- Hey Mike… Come here a sec… We need your help.
- Sure. What is it?
- Need you to find someone.
- OK… who and where?
- Name’s Waldo. Here’s his background. He’s in New York City.
- New York City?? I’m supposed to find him there? Just like that?
- Yup. Oh, come on, don’t look at me like that. You did a great job last time.
- Last time? Are you serious? That was Tonopah! There’s, like, three main ways in and out. A handful of city streets. And great visibility, so even if someone takes the back road, you can spot them 20 miles away from the air. How can you even compare that to New York City?? And besides, if you’ve been on his case, why did you lose him in the first place?
- Now, let’s not start the finger-pointing. This is all of our problem; let’s make it all of our solution.
- OK, so do you have any people on the street to help locate this guy?
- No, that’s your job.
- My job? So much for “all of our solution.” It would help if you had told me ahead of time so I could have had the resources stationed and eyes open from the moment he walked into town.
- Yeah yeah, it’s always somebody’s fault with you. Now just get in there and do your job, and I don’t want to hear from you unless it’s a phone call saying you’ve found him.
Start up a discussion about debug, and you’ll get lots of people interested. Specify further that you want to discuss SoC debug after you’ve got silicon in hand, and, well, suddenly a lot of the hands go down. Everyone wants to tout verification – before silicon. Post-silicon? Well, that’s easy. Just do a great pre-silicon verification job and you won’t ever have to do post-silicon debug.
Great. Meanwhile, back in the real world, a chip comes out of fab, and something’s wrong. It may fail on the bench, it may fail on the tester, it might even wait to fail until it’s in-system executing sophisticated software in the home of some unsuspecting consumer who’s enjoying a lazy summer evening, unaware of the chaos brewing in that innocuous-looking little box. In fact, the better job you do on verification, the more likely it is that any problems will crop up in obscure, unexpected, hard-to-find places. Those are, after all, the most likely places that it never occurred to you to verify before taping out.
Debug takes work and tools, and, most importantly, it takes preparation during design if you’re going to have any chance at success. We’re not talking simple 20-pin chips that you can toss onto a breadboard; these are monstrously large chips with multiple-boards’-worth-of-stuff buried deep within layer upon layer of logic and protocols. The problem is, debug doesn’t have anywhere close to the same ROI payoff that pre-silicon verification has. After all, the whole point of buying all those verification tools in the first place is to avoid a mask spin – that’s where the big money is. In fact, you spend a ton of time verifying just to save that money.
By the time you need debug tool – well, it’s already too late. You already need the mask change; the debug tools won’t help you there. They won’t save you money; they’ll only save you debug time. Yeah, that’s important, but you know, if we just concentrate on verification, then we’ll get it right the first time and won’t have to worry about debug. And so it goes.
The political issue with debug is pointed out by debug advocate Neal Stollon of HDL Dynamics: it’s hard to find a win for the designer. “The only reason you found something post-silicon is because I didn’t do my job pre-silicon.” No one wants that on their resume.
An overall approach to debug
So let’s go from here under the assumption that there’s an issue – so yes, we need to debug, and yes, it sucks that we have to. If we can man up and accept that and move on and be done with the recriminations, then we’ve jumped the first hurdle. And we come to the next harsh reality: there’s no way, no how, that you’re going to be able to solve a debug issue by doing debug alone. Unless it’s a trivial chip problem. In which case you’ve got a non-trivial career problem since you should have caught it earlier.
The only way you can figure out what’s going on is by learning as much as you can from the silicon and then moving that back into your verification environment, where you have much more access to the internal workings of the chip. Or at least to models of the internal workings. Working on the assumption that the models are correct…
And here we come to yet another unfortunate reality: debug tools are not, by and large, well connected to verification tools. Debug tools are things like logic analyzers and scopes; verification tools are simulators and analysis tools. If anything, debug tools are closer to test tools. So taking the information learned from debug analysis and feeding that back into the verification environment is not automated, may well be tedious, and requires engineering judgment.
So, bucking up yet again so that we can move forward, we now need to figure out how to employ the verification tools. The “obvious” approach is to try to figure out the conditions under which the problem occurs and then set up simulations to see if the problem is replicated. In practice, this can be tough, both because the internal state of the chip is critical and may be hard to discern and because it may take millions of clock cycles before the problem shows up, and simulating that is simply not viable.
If you use emulation as part of your verification strategy, you can exercise many more vectors, so by trying to recreate the state in the emulator, you may be able to replicate the issue. Eve’s Ron Choi points out that some assertions are synthesizable, so you can add a few relevant assertions to the design to raise flags if pertinent conditions occur while you’re executing the system.
Formal analysis tools provide an alternative means of feeding symptoms in order to figure out causes. In principle, as illustrated by OneSpin’s Michael Siegel, you can write an assertion for the way the circuit is supposed to work in the failing case, and then let the formal tool identify the conditions under which that assertion will not be true, and this can point to the problem.
But, as Cadence’s Tom Anderson points out, you can’t realistically analyze an entire giant chip. You need to go further to isolate a subsystem, which may take more sleuthing on the chip side before you can go back to the verification side. The idea is still the same: create an assertion to model the problem and search for the cause; you’re just applying this technique to a manageable portion of the chip.
Getting the information you need
This all sounds relatively straightforward, but the tough part is getting the information from the chip to feed into the verification system. Forget just monitoring outside pins. You need help from the designer – before the design tapes out – to have some hardware added so you can get a better view of what’s going on inside. This is the realm of instrumentation.
Instrumentation comes in two flavors, more or less: software and hardware. Much of the complexity of debugging comes from the fact that SoCs have one or more processors on them executing sophisticated software. The mere feat of successfully booting a modern operating system is something to be celebrated. So the lion’s share of the attention has gone into providing processor-based systems with resources for debugging software.
Software debug fundamentally consists of watching how the program executes, inspecting memory, and spying on the busses. The bulk of the debug IP provided by the likes of ARM and MIPS is directed at these tasks. But that’s a lot of information to get out through very little hardware in very little time. The most obvious task is watching program flow to figure out what’s happening. Trace facilities let that happen, but in order to reduce the amount of information needed, they don’t actually tell you what instructions are executing: they assume you have a copy of the program nearby, and that you can use it to sing along with the processor. So it largely focuses on pointing out which branches got taken, which cuts out a lot of the clutter.
Getting at what’s in memory is a bit tougher: it’s more or less impossible to dump the entire contents of memory in any reasonable amount of time during execution. It may be possible to get a snapshot of what’s in there once you’ve stopped the system – for example, after the bug has reared its head, but keeping a running eye on memory, and, in particular, establishing some starting state of the entire system that might allow you to simulate or emulate from some point other than system reset is more or less impractical, if not impossible. This is where judicious instrumentation of software can help. Yay for printf! Now… just need to attach a printer to the chip…
Bus monitors can also keep an account of who’s accessing which bus resources. That, along with the instruction trace, can be streamed out to somewhere for analysis. And that “somewhere” is one of the design decisions that have to be made up front. Highest debug performance is possible if you buffer the streamed data on-chip, and then send it off-chip to a debug tool after the chaos and commotion of execution have subsided. This means, of course, that you have to have designed these buffers onto the chip. You can have one or more buffers capturing various streams, and they can then be multiplexed out some narrow pipe for interpretation. MIPS’s Rick Leatherman notes that you can even repurpose caches as buffers in order to avoid having to add memory buffers that are used only during debug.
These debug tactics are manageable for your run-of-the-mill simpler chip. But as ARM’s William Orme points out, the challenges are compounded in the presence of multicore architectures, power domains, clock domains, and various power-down and sleep modes. This is why debug circuitry can’t necessarily be tossed on at the last minute as an afterthought – it may require an actual architecture. You’re going to be thumping your head on the wall if you try to debug an issue only to find, for example, that part of the debug circuitry is asleep. And you may have to put cross-triggering matrices in place so that an event on one processor can stop the other processors as well in as few clock cycles as possible (a characteristic colorfully known as the “skid time”).
But I’m a hardware guy
All of that work, and all we’ve done is debug the software. What about the hardware? Hardware, by nature, tends to be less structured overall than a software-execution environment, so it takes more thought and design to put in place a resilient set of debugging resources. In fact, there are far fewer providers of hardware debug resources than there are for software.
DAFCA is one such company, and they approach the problem by providing a variety of hardware tools for creating custom debug structures. As described by Paul Bradley, you start by identifying blocks that you want to instrument: examples are busses, key interfaces, state machines, arbiters, etc. Registers and monitors can be placed around the outside of that block for later use. The debug blocks are reprogrammable so that the specific debug tasks aren’t hard-coded into the chip. The specific debug function can be changed on the fly, in the field, as needed – assuming there is enough hardware in place. For example, most of the monitors use a state machine – you need to instantiate a state machine that has enough bits to do the things you think you might want to do. If, later on, you want to program in a function that requires more bits than you have, you’re stuck.
With this kind of arrangement, the infrastructure is distributed, with various instruments here and there, and yet it can all be tied together to allow a unified test or debug session. An external database keep track of the instrumentation that’s laid down so that the results can be viewed in a coordinated fashion instead of as an assemblage of the apparent spoutings of various random instruments.
There are other little ways in which debug can be facilitated. Calypto’s Tom Sandoval points out that clock gating, while an effective means of reducing power, can complicate debug. So as an example of one of these “little things,” they allow the inclusion of a master switch to disable all clock gating to remove this potentially vexing factor during debug. Mentor’s Geir Eide points out that as you go 3-D – stacking dice – you also may need to provide some isolation so that the layers can be individually accessed without constant interference from others.
A more aggressive goal is to put in place the infrastructure to provide joint hardware and software debugging, which Imperas’s Larry Lapides feels isn’t well enabled so far. This has implications both for the debug instrumentation and for tools, but also for the verification models and tools that will take the debug info and further help to nail the cause of the problem. Specifically on the debug side, Carbon Design System’s Bill Niefert notes that considering debug earlier in the architectural stage can help to pull the hardware and software debug elements together. And when adding hardware instrumentation, blocks that can be called by software help to bridge that gap from hardware to software.
The IP world can sometimes work a bit differently, since those vendors have a desire to keep their circuits as mysterious as possible and protect the crown jewels nestled tantalizingly inside. As noted by Tony King-Smith and Mark Dunn at Imagination Technologies, this can mean that a more thorough job will be done on instrumentation so that a simple scan can suffice. It also means that they need to do as much as possible to verify their particular block, since they want it to be rock solid in any instantiation. Whether during verification or debug, if something goes wrong, someone’s going to want to crack open the black box and peer inside; they don’t want that.
There’s one hardware area where few people dare tread, however: analog. It’s no accident that analog portions of a circuit tend not to push the limits of a technology and that known good circuits are reused as much as possible. Not only is it harder to conceive of a general debug paradigm for analog blocks, but the very existence of instrumentation could disrupt the behavior of the analog stuff. Realistically, analog designers are on their own when it comes to debug: instrumentation can reverently approach the boundary beyond which lie the softly-spoken magic spells, but they dare not cross.
How the heck do I get in here?
All right. So far, then, we have instrumentation where possible inside the chip to help us get a glimpse into the inner goings-on as things go awry. This instrumentation lets us control and observe the state of the system. But we need to control and observe the information that the instrumentation extracts. How do we get this stuff on and off chip? We’ve talked a bit about buffering already – under the assumption that we can generate internal data way faster than we can stream it off-chip.
There are a lot of options when it comes to test access – especially if you want to roll your own. You can have multiple ports and customize to your heart’s content. But you need to connect those ports to something that’s going to make sense out of the zillions of ones and zeros that are going to be screaming through the wires, and that means, unless you want to create your own tools as well, that you’re better off using a standard.
And it would be nice if you could use the standard. But you’ll have to be content with using a standard, one of the many options out there. And the many that are still in the works. The granddaddy of them all is JTAG, of course, but even that’s becoming less simple as JTAG variants are standardized to bring it up to date and address various needs.
In addition, the Nexus standards group has been taking work done originally on behalf of the automotive industry and has generalized it under IEEE 5001. As Mr. Stollon points out, the focus of this effort is on embedded processor debug, with all of the elements defined as necessary to connect the thing up physically and get data through it, along with some on-chip features and an API for the tools.
Meanwhile, the mobile industry is doing its own thing with the Mobile Industry Processor Interface (MIPI) effort. They are specifying a trace protocol and a parallel interface, while recommending a connector format.
There’s also work on the IP side of things to allow blocks of IP to be integrated into the overall debug structure of a chip. There are, of course, multiple efforts here. The SPIRIT consortium, through its IP-XACT efforts, and the OCP-IP groups are both working in this area.
Are there any gotchas?
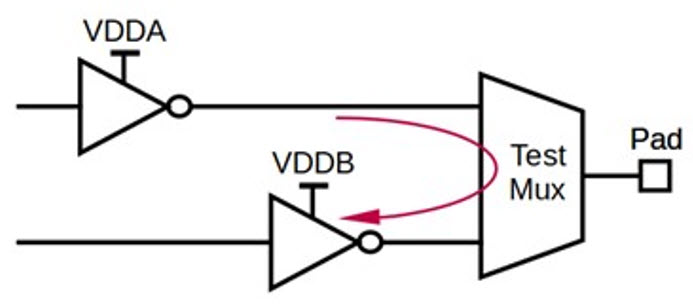
Obviously adding hardware to a chip increases the cost. To the extent that some chips are pad-limited, internal circuitry is less expensive – unless pins need to be added for access, in which case it can be very expensive. In general, you can buy yourself a pretty good set of debug features for 1% of the die size or less.
Mr. Stollon points out one more consideration that’s generally raised as a huge concern in so many areas of our lives, but rarely in the debug discussion: security. The good news about debug is that you get great visibility into the inner sanctum. The bad news is that others can get great visibility into the inner sanctum. This is, it would appear, an as-yet unsolved problem. There seems to be some hushed work going on to address this, but nothing is on the public radar at this point. Certainly an area to stay attuned to.
All in all, SoC post-silicon debug remains an under-loved discipline that, in the worst case, costs a bit of silicon and design time and is never needed, and, in the best case, saves your butt when you’re trying to figure out why, only on an occasional sultry summer night, only when the air and the sheets cling desperately to you and the fireflies are in mad bloom and the frogs are singing their sexy come-hither songs and the saxophone wafts lazily across the field from the tavern at the edge of town, the screen turns a mysterious blue, and it’s your job to figure out why. It’s like tracking down Waldo in New York City. You can do it the hard way, or you can do it the… less hard way.
Links: