


“One of the funny things about the stock market is that every time one person buys, another sells, and both think they are astute.” – William Feather
Hooray, your company has gone public! You and all your coworkers can now stare at real-time stock tickers all day long, tracking your newfound wealth, second by second. Hey, our stock is going up! We’re awesome! Oh no, the price is heading down! What did we do wrong?
Like cats with a shiny new toy, employees in a newly public company have a fascination with their own share price. It moves, it has lots of bright colors, it’s fun to watch, and it means almost nothing to them. We all kinda, sorta understand that if the chart goes up and to the right, that’s a good thing. But what do all these numbers mean, what’s a P/E ratio, and what are EPS, ask, bid, or market cap?
In order to trade stocks, you need to have a brokerage account, visit https://www.stocktrades.ca/ to get one.
Let’s see if we can demystify a stock chart.
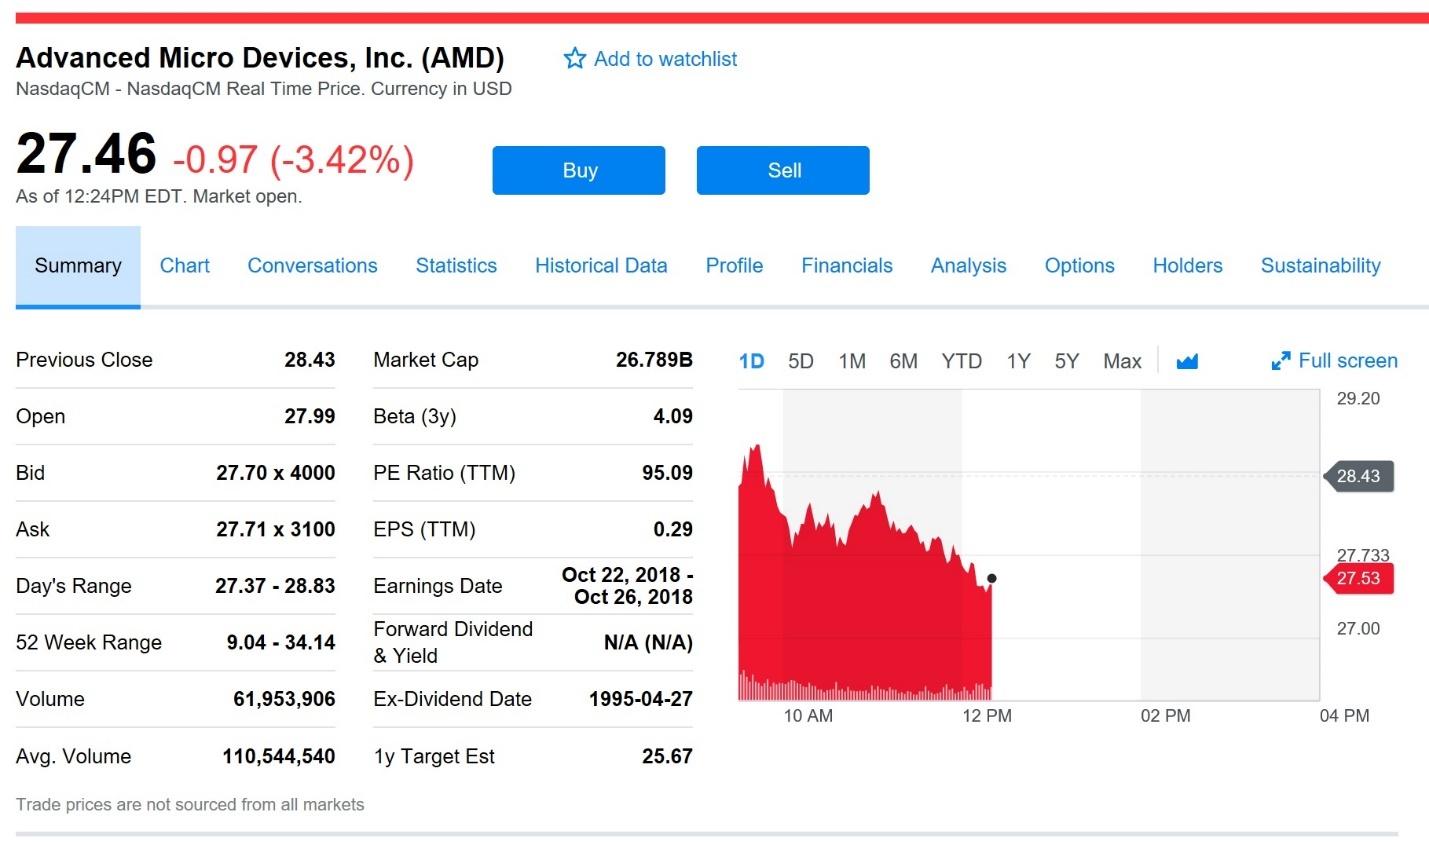
Here is AMD’s stock chart from a few weeks ago from a Hargreaves Lansdown share dealing report. Right off the bat, we can see that the chart is red and heading downwards. Oh, dear. A bad day for AMD shareholders, apparently. The big number in the upper-left corner tells us that AMD shares are trading at $27.46 at the moment. Watch the chart for a few minutes, though, and it’ll change. Most companies’ share price changes by the second, so the longer you watch, the more you’ll see it move. But, to paraphrase Ben Hecht, trying to gauge the health of a company by its instantaneous share price is like trying to tell time by watching the second hand of a clock. There’s a Nyquist-Shannon sampling limit to gleaning useful intelligence from share prices, and it’s a lot longer than just a few minutes.
The smaller red numbers, -0.97 and -3.42%, are the change in the share price since yesterday. That is, the price right now is down 97 cents compared to when the market closed at 4:00 PM the day before, which equates to a 3.42-percent decline. Both numbers are in red; if the price were heading upwards right now they’d both be green.
The big red graph, of course, shows the state of play, minute by minute. This is a one-day chart – you can just make out the blue “1D” above the graph – so it represents just the first few hours of trading this morning. This snapshot was taken at 12:24 PM Eastern Time, or 9:24 in the morning AMD time. The chart will slowly grow in real time until it reaches the 4:00 PM mark at the end of the trading day.
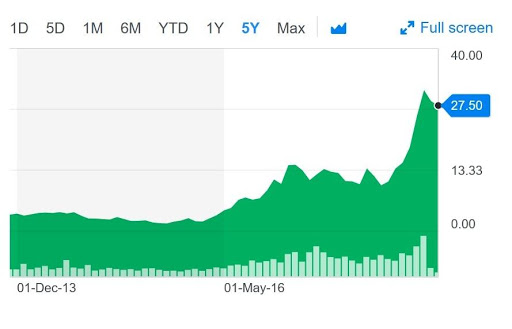
On most financial sites, you can view the company’s share-price changes over longer periods, like a week, a month, a year, or even five years. AMD’s progress over the last five years, below, looks a lot rosier than the one-day snapshot above.
Who’s Doing What to Whom?
First, some basics. Shares in AMD, just like the shares in your own company, aren’t bought and sold by the company. You’re not buying AMD shares from AMD. You’re buying them from somebody who already owns the shares and wants to sell them. AMD is completely out of the picture. Thus, all stock transactions are used-cars sales. The only “new” shares were the ones issued on IPO day. After that, they just change hands, over and over.
There is a finite number of shares, and they’re all owned by somebody at any given moment. Like matter and energy, shares are neither created nor destroyed, only converted. You can sell shares to me; I can sell shares to you. They don’t ever go out of circulation and, with just a few exceptions, the company won’t arbitrarily issue more shares or take any shares away.
This is important, because Economics 101 teaches us that scarcity affects desirability. There’s only one Hope Diamond in the world, and it’s worth a lot. On the other hand, there are a lot of Casio watches. If the number of shares in the market pool stays fixed, buyers and sellers will have to trade them amongst themselves: you have a stock market.
Second, nobody is setting the share price. There isn’t some benevolent (or malicious) dictator in the Nasdaq, the NYSE, or the Illuminati controlling the share prices we saw in the graphs above. That’s free-market supply and demand at work. If you want to buy AMD shares, you have to buy them from somebody who already holds them and they, in turn, must be willing to sell them. If/when you two agree on a price, that’s the price of the transaction. Presto! You’ve just established the “official” share price for AMD, at least for a few nanoseconds. The very next trade may be at a slightly different price, not to mention the trade after that one, and so on. There is absolutely no oversight or control on the share price. Neither AMD, nor the stock market, nor the government, has any say about the buying or selling price of shares.
It works just like parimutuel betting at a horse race. One horse is paying 2:1 odds, while another horse is a 40:1 longshot. Nobody set those odds; they’re automatically calculated by the bettors’ own bets. If, for whatever reason, everyone seems to like betting on Horsey McHorseface, then his payout goes down because he’s apparently a low-risk favorite to win. Conversely, if hardly anybody bets on Wear The Fox Hat, his payout will go up.
It’s the world’s simplest algorithm. Rather than try to calculate the correct price for shares, or the fairest odds for a racehorse, rely on the “wisdom of crowds” to sort itself out.
Finally, unlike a used-car transaction on Craigslist, you won’t actually meet your stock’s buyer or seller. You’re not dealing one-to-one, and you don’t haggle over price at the local Starbuck’s. Instead, you put in an order with your stockbroker (likely an automated system like e*Trade), and it handles the transaction on your behalf. Your shares will go into the big pool of available shares for someone else to buy. They will get bought; you just don’t know who the particular buyer will be, or the exact price. Similarly, when you buy shares, they come out of the pool, from someone who just sold theirs.
Previous Close
Okay, back to the stock quote. On the left side is a big table of numbers, with 16 factoids in all. (This is from the Yahoo Finance site; other sources may provide different information.)
The “previous close” is the price of the very last trade done yesterday. The shares stayed at that price all night, because the market itself (in AMD’s case, the Nasdaq) was closed for business, so no shares could change hands until the Nasdaq reopened this morning at 9:30 AM. Even though the share price can’t officially change overnight, shareholders might still have late-night fever dreams about buying or selling, especially if some relevant news pops up in their Twitter feed. When the market reopens, investors might have already decided they want to buy or sell, so the price may have shifted a bit.
Open
The opening price reflects this change. It’s the price of the first shares transacted when the market opened, which isn’t the same as the previous day’s closing price because demand for shares has changed overnight. In this case, the open is $0.44 lower than the close, so something dulled demand in the moonlight. Not by much, though. There’s less than a 2% difference between the close and the subsequent open.
Bid
Because share prices aren’t controlled by anyone, they bounce around based on supply and demand. If demand is high, the price rises. No surprise there. The “bid” price is the maximum price buyers are willing to pay at that moment. It doesn’t mean you’ll necessarily get that price if you sell your shares, but it’s a good estimate.
The “27.70 x 4000” means that somebody, somewhere is willing to pay $27.70 for a block of 4000 shares of AMD stock. That’s the best price you’d get if you had 4000 shares to sell right now.
Ask
Conversely, the “ask” is the asking price: the price potential sellers want to get for their shares. There’s always a spread between the bid and the ask – called the “bid-ask spread,” unsurprisingly – and the gap gives you some indication of the supply/demand equation for those shares. Again, the “x3100” means that that price is for a block of 3100 shares.
The ask is higher than the bid for the simple reason that both sides want the best deal they can get. Many transactions will conclude at a price somewhere in between the two extremes.
Day’s Range
This is pretty self-explanatory and lists the highest and lowest prices the stock has seen so far today. This number will start out small in the morning and widen throughout the day as the share price rises and/or falls a bit more. A big daily range suggests that the stock is “volatile” – that its price is fluctuating wildly throughout the day, usually a sign of big news coming.
52-Week Range
Like the day’s range, the 52-week range gives you some idea of the highest peaks and lowest valleys this stock has hit throughout the past year of trading. Note that this is not a calendar year, or even the company’s fiscal year. It’s a rolling 52-week statistic.
In this case, AMD’s stock has gone from a low of $9.04 to a high of $34.14, both at some point in the last year. You can’t tell from this when those two events occurred without looking elsewhere for more data. It’s possible (but unlikely) that the low and the high both happened on the same day. Or, they may have occurred months apart. Since shares are now trading at $27.46, it’s close to its 52-week high.
Volume
Volume measures the number of shares that have changed hands today. This number starts at zero and increases throughout the day, then resets to zero on the next trading day. Obviously, this number always goes up, not down; you can’t undo a sale. So far today, almost 62 million AMD shares have changed hands. But the day is young.
Avg. Volume
On an average day, about 110 million AMD shares change hands, so we’re about halfway though an average trading day. Comparing the daily volume to the average volume gives you some idea of whether today’s trading is normal for that company. Is there an unusual amount of activity today? Maybe the company just announced some good news and a lot of people are buying (and therefore, another group is selling) AMD’s stock. The price volatility and the volume volatility are both indicators of normal vs. unusual activity in a company’s shares, and they factor heavily in investors’ secret trading strategies.
Market Cap
How do you measure the size of a company? Do you go by headcount, or the number of square feet in their headquarters building, or by annual sales? What about profit margins, or growth potential? There are a lot of ways to measure “bigness” in public companies, but the most common way is by market capitalization, or “market cap” for short.
It’s a simple number, really. It’s just the number of shares multiplied by the price per share. If your company issued 1 million shares on IPO day and they’re now trading for $4.25 per share, your market cap is $4,250,000. It describes the “capitalization” – the money-ness – of your firm in the market (the stock market). Pretty simple.
When media reports say that Apple is the first trillion-dollar company in history, or that Google is bigger than General Motors, they’re referring to market cap. It’s the single easiest way to gauge the overall size of a company. Even though, as we’ve seen, the company itself has almost nothing to do with its own share price. Market cap is a barometer of what the public thinks of the company (specifically, the shareholding public), not what the company thinks of itself.
Theoretically, your own company can reach an enormous market cap by doing nothing at all. If investors think that you’re on a rocket ride to profitability and start bidding up the stock, your market cap will increase through no efforts of your own. It works the other way, too, of course. If investors lose confidence in your company, your share price, and thus your market cap, will fall. Not much you can do about it either way.
Beta
A company’s “beta” or “beta coefficient” is just one of many (many, many, many…) derivative values that investors use to try to estimate a company’s growth. It’s a measure of volatility: how much does this company’s stock fluctuate compared to other companies, or compared to some neutral benchmark? A beta value of 1.0 means the company is exactly as volatile as the comparison (i.e., they both behave about the same over time). A value less than 1.0 means it’s less volatile, and greater than 1.0 is more volatile. It looks here like AMD is about 4× more volatile than average. That sounds about right.
This single number leaves out a lot of information, of course. What are we comparing AMD’s shares to? The global market as a whole? Other technology stocks? Just semiconductor stocks? Some sort of index, like the S&P 500 or the Dow Jones Industrial Average (DJIA)? Also, over how much time? In this case, it’s a three-year regression average (that’s the “Beta (3y)” part).
PE Ratio (TTM)
Here’s another acronym for a number designed to help you predict the value of a stock. In this case, it’s ratio of share price to the company’s profits (earnings), averaged over the last year. The arithmetic is simple, but the numbers need some explanation.
- The P is simply the share price, which we already know.
- The E is for earnings, another name for the company’s profit. But the earnings for a big company is a huge number, so E is really the earnings divided by the number of shares in total, called earnings per share (EPS), which is significant enough to get its own place in the table, below.
- TTM is a trailing twelve-month average of the EPS number. It’s there to smooth out the EPS number, which can bounce around a lot from quarter to quarter.
Roll that all up and what do you get? The PE ratio gives you a number (95.09 in this case) to gauge how expensive the share price is compared to the company’s profits. Because the price, P, and the earnings, E, are both measured per-share, this gives you some idea of how much it would cost for you to buy a piece of the company’s profit-making potential. A high PE ratio means that investors are optimistic about the company and its prospects. A low PE ratio means investors aren’t willing to pay much beyond a year’s worth of profits for a piece of the company’s stock.
Note that the PE ratio isn’t a dollar price, it’s just a number. Think of it as a multiplier or a coefficient. Also, the P part (the share price) changes constantly, but the E part (the earnings per share) changes only four times a year, when the company announces its quarterly results. High-tech companies like AMD tend to have much higher PE ratios than stodgier “blue chip” stocks. It doesn’t make much sense to compare PE ratios between companies in different industries (agriculture versus semiconductors, for example), but comparing AMD and Intel is sensible.
EPS (TTM)
Earnings-per-share, or EPS, is a basic sign of the company’s profitability. As we saw above, it’s the company’s overall profit divided by the number of shares in the trading pool. In AMD’s case, it’s making $0.29 profit for each share. If AMD were to give away that profit to its shareholders, everyone would get 29 cents for each share they owned. Positive numbers are good; negative numbers are bad.
The TTM (trailing twelve months) part means that this 0.29 number is taken not just from the most recent earnings report, but is averaged over the last four quarters. This smooths out short-term variations in earnings and gives you (you hope) a better idea of the company’s profit potential.
Earnings Date
Finally! An easy-to-understand date. “Earnings date” is simply the approximate date of the next public reveal of the company’s financial details. All public companies are legally required to disclose their financial results four times per year (that is, quarterly), and this tells you the next time that will happen. It’s a one-week range instead of an exact date because companies are given some leeway in timing their public announcements.
If the last quarterly report was fairly recent, then you and all the other investors are up to date on the company’s status. If it’s been awhile, though, you and everyone else will be investing based on old information. Changes in share price often come right before, and right after, those quarterly announcements.
Forward Dividend & Yield
Some companies actually pay you to hold onto their stock. They take a portion of their profits and pass it out to shareholders as a “dividend.” It’s like a savings account at the bank that pays you a small amount of interest on a regular basis.
Not all companies pay dividends, and very few high-tech companies do it at all. Dividends are mostly an old-school “blue chip” thing, because they make up for the lack of exciting growth opportunities. If you want risk, you invest in high-tech, high-growth stocks where the share price may rise dramatically (or crash just as dramatically). But if you’re a “widows and orphans” investor, a blue-chip stock that’s going nowhere but that pays out a small dividend every quarter is a nice alternative.
Assuming the company you’re investing in does pay dividends, this number will project what those payments might be for the coming year. Like EPS, it’s annualized to smooth out short-term fluctuations. And, like the PE ratio, it’s calculated per-share, so that you can figure out what your take will be. And finally, it’s expressed as a percentage, not a dollar amount, so you still have to do some math.
Ex-Dividend Date
This is simply the last time the company paid dividends, if ever. In AMD’s case, it hasn’t paid its shareholders dividends since April 1995.
1y Target Est.
This is the only number (on this screen, anyway) that isn’t a hard value based on historical data. It’s a guess. An educated guess, perhaps, but still a guess, of where the share price will be in a year.
Financial analysts make their living by scrutinizing public companies, putting their ears to the ground, reading tea leaves, sacrificing goats, and myriad other techniques to divine the motions of the stock market. They roll up that intelligence and sell their prognostications and estimations to their clients, who then make investment decisions based on that information. When several independent analysts all follow the same company – which is common for large firms like AMD – then this number will reflect their combined projections. This is what’s meant by “analyst estimates” or “the Wall Street consensus” of a company’s future earnings.
It’s a SWAG. And it’s often badly out of date on public sites like this one. To get the latest analyst estimates, you have to pay the analyst(s).
Shares Outstanding (not shown)
Although this table doesn’t show it, a useful number to know is “shares outstanding,” or more simply, the total number of shares the company has issued and are now trading on the stock market. In AMD’s case, it’s about 975 million shares. Multiply that by the $27.46 price per share and you get the $26 billion market cap we saw earlier. Easy!
Float (not shown)
The “float” is a subset of the shares that are actually available for trading. It’s a somewhat smaller number than the total shares outstanding because some shares are held by “insiders” who can’t trade their shares in the normal way. That list might include you. Insiders are people who have special, inside knowledge of the company’s finances and are therefore legally restricted in how they can buy and sell shares. Insiders are deemed to have an unfair advantage over the average investor, so they have to play by different rules. More on that next week.

