I just heard about a new code coverage tool from Microchip Technology that’s targeted at embedded designs, that’s quick and easy to use, and that does things no other code coverage tool has done before. Just writing that gave me a flashback to the opening spiel of Star Trek: The Original Series, where the narrator waffled on about “Boldly going behind the beyond, behind which no man has boldly gone behind, beyond, before,” or words to that effect. But we digress…
Oh Dear!
I’ve said it before and I’ll say it again — in fact, I’ll tell anyone who doesn’t manage to get out of the way fast enough — I’m a hardware design engineer by trade and I’m proud of it. When I was a student at university, one of my daydreams was to be at a party after I’d graduated, for someone to ask me, “What do you do?” and for me to reply in a deep James Earl Jones voice: “I <pause for effect> am an engineer!” But, once again, we digress…
Over the years, I’ve worked with a variety of assembly languages, along with some higher languages like BASIC, Forth, FORTRAN, Pascal, and Python, and I currently capture most of my hobby project code in C with a hint of a sniff of a dribble of C++. All in all, however, anything I know about the software side of the fence has been hard fought for, and any code I create should be treated with suspicion (“guilty until proven innocent “would be a good rule of thumb).
The thing is that, on the hardware side of things, I’m au fait with the wide variety of test and verification tools and technologies we use, including simulation, emulation, and formal verification. However, I’m afraid I’m much less conversant with the way these things are approached in the software domain.
In the case of my own programs, which are predominantly created in C/C++ using the Arduino IDE, a typical development cycle involves my capturing a few lines of code, compiling the code (which itself requires a few rotations to weed out any obvious errors I inserted just for giggles and grins), running the code, and looking at the results (or lack thereof) in bemusement.
Most of the time, nothing happens, or appears to happen, whatsoever. On occasion, just to break the monotony, something completely unexpected occurs. If I’m lucky, this doesn’t involve anything starting to melt or smoke, but I wouldn’t place money on this being the case.
This is the point where we enter Phase Two (or Phase Deux, as the French would have it). This involves my inserting Serial.print() statements, scattering them throughout my code like confetti. One of the really frustrating things is when the act of inserting a print statement causes the code to start working, and the act of removing that statement results in the code returning to its non-working state. “Oh dear,” I might say to myself (or words to that effect).
When You Come to a Fork in the Code…
Another problem I often run into is that I get my program running and pat myself on the back, but I haven’t tested every possible use model. I usually discover this fact when I proudly demonstrate my creation to a friend, during which we return to (a) nothing happening (boring) or (b) something unexpected happening (puzzling) or (c) something horrible happening (exciting, but not in a good way).
The problem here is that my original tests hadn’t actually verified all of the code. In some cases, it might be that I’d exercised only what would happen if the condition associated with an if () statement returned true or false, but not both circumstances. In other cases, I may have neglected to exercise entire functions.
Thinking of the branches in conditional statements reminds me of the quote that is commonly attributed to the legendary Yogi Berra: “When you come to a fork in the road, take it!” If only it were possible to evaluate both branches in the code simultaneously. But, you guessed it, we digress…
I remember 40 years or so ago, when software developer friends would use printf () statements to attempt to ensure that every function had been run and every conditional branch had been exercised, but as the code grows larger and larger, this technique becomes harder and harder to perform by hand. Also, it’s one thing to use this technique on a workstation-class computer with lots of memory and a disk drive; it’s quite a different proposition when working with an embedded microcontroller unit (MCU) with limited memory and other resources.
All of which led to the creation of code coverage tools for use by software developers. Sad to relate, until now, I’ve had only a fluffy idea as to how these tools perform their magic. My high-level understanding was that, when you run your application (I would assume under the control of a test script so as to ensure repeatability), the code coverage tool would report how much of your code had been tested and what proportion had been left untouched.
Of course, knowing that x% of your code has been exercised is of limited use — you also need to know which functions have been run and which conditional branches have been tested, or not, as the case might be.
Ideally, your integrated development environment (IDE) will have a context-sensitive editor that can display the code coverage appropriately, indicating which portions of the code have been tested or not, and being capable of working at the function level or the source code line level.
In fact, you really need a finer resolution than the source code line level, because each line in C can potentially contain multiple statements, and don’t even get me started talking about the conditional, or ternary, ?: operator in C/C++.
Actually, if the truth be known, when we are talking about embedded applications, it may even be desirable to be able to view things at the assembly instruction level of abstraction, because each high-level statement will typically expand into multiple assembly level instructions.
Don’t Assume
A few days ago as I pen these words, I was chatting with David Otten, Development Tools Marketer, Microchip Technology. Based on what you’ve read so far, it may not surprise you to hear that the topic of our conversation was code coverage. David was telling me about Microchip’s new MPLAB Code Coverage tool, which he believes to be the greatest thing since the invention of sliced bread.
As part of our conversation, David mentioned that a surprising number of professional embedded software developers don’t use code coverage at all. To be honest, I found this a bit hard to believe — if you’d asked me a few days ago, I would have assumed that the vast majority of embedded software developers used such tools — so I sent a few emails out to some developers I know asking them what tools they use.
You can only imagine my surprise to discover that the only one of my friends I questioned who actually uses code coverage at all is Jacob Beningo, founder of the Beningo Embedded Group, who says he uses Segger Ozone. Now, I don’t want to put words into Jacob’s mouth, but we chatted on the phone, and my understanding is that using this tool requires you to instrument the code and for it to stream code coverage data out of a test port during run time. Although Jacob had only positive things to say about the tool, I have to believe that using it impacts the system’s performance.
Another of my friends is Jonny Doin, who is Founder and CEO at GridVortex Systems in Brazil. In addition to mission-critical and safety-critical systems, such as those found in nuclear power stations, GridVortex focuses on large-scale urban infrastructure projects involving highly scalable intelligent systems.
In response to my original email, Jonny said that they used to use code coverage at GridVortex. More recently, however, they’ve moved to using extensive peer review and unit testing. On being questioned as to what tool they used to perform unit testing; Jonny responded as follows:
We do not use an external tool. Let me briefly give you a flash walk-through of how we perform unit testing:
- Our framework is written in C, using the very same system approach you would find in the early Unixes, but with a radically different implementation.
- The systems we design are hard real-time systems, usually with a critical DSP signal path, for high availability industrial systems.
- We adopt aspect-oriented design, and explicitly perform a continuous evaluation of cross-cutting concerns, aspect separation, class balancing, knowledge limiting, and local complexity reduction.
- The system architecture is heavily modelled on datapath/control path, with stream orientation. Every data flow is a stream, and the code is usually made of small threads with a finite state machine that sits between data FIFOs.
- Our lower levels are very similar to VHDL processes, with FSM and logic implementing protocols and inter-thread sync. Higher level layers, like the JSON parser class, are implemented as FSMs with minimal system blocking time.
- Our higher levels are heavily modelled on the MVC abstraction, with Models, Controllers, ViewControllers, and Views. Sometimes the MVC abstraction encompasses threads running Models and Controllers on the Embedded server-side, and Javascript running ViewControllers in browsers.
- Our multitasking Kernel implements a multimode threading model, where any process can be scheduled as a round-robin schedule, or as a time-triggered preemptive hard schedule, and several signal path interrupts.
- Typically, a thread blocks for a few microseconds, with a very high frequency multitasking.
- The code is very compartmentalized, with namespaces, interface classes, and traditional classes. We do NOT implement multiple inheritance or RTTI, but we liberally use anonymous compound literals and polymorphic interfaces.
- The system is absolutely asynchronous; i.e., every function is thread safe and all interfaces support completion callbacks. Thus, we have async versions of all NetBSD functions, all TCP calls, and the fileio (fread/fwrite) all have async interfaces. This allows zero blocking calls on the whole system.
- One of the lower level components of the system is a terminal server class, that supports multiple terminal sessions of a CLI (command line interface).
In this architecture, each domain class or code layer in a given API chain has a very small exposed area. This is where unit testing enters the flow.
Every subsystem, usually implementing an interface class, has a CLI command module that exercises all aspects of the interface, with a raw exposed command line to completely test the interface.
Some classes have normative requirements for online test logic to be part of the normal object execution. This is the case of all cryptographic primitives and some cryptographic constructions. For example, DRBGs and Entropy Pools are required to implement online continuous statistical tests to measure and guarantee high entropy distribution, some fieldbus protocols are required to have semantic observers, and some control functions are required to have control loop integrity checkers. Cryptographic primitives are needed to have user-accessible test suites to test compliance to all approved test vectors for that primitive.
To guarantee compliance to the design goals, however, every single Interface or Class must have a Unit Test command interface, usually composed of a manual set of commands and command-driven test models, to test the corner cases and aspects. The system has a set of system tools that perform stack introspection, memory read, and timing observers, to help characterize any running object. Through the Unit Test command modules, you can completely isolate and test a class or a complete subsystem, before integrating it in a functional flow on the target system.Part of the unit test framework consists of hardware measurements. We have at least 16 high speed parallel lines of GPIO that are hooked to an external Logic Analyzer, and we have DACs connected to an Oscilloscope. We use a Tektronix MSO (16 digital + 4 analog) as a software unit testing tool.
The code under test is instrumented with GPIO debug bits activated in places of interest (e.g., State Machine states) and can be observed with 1 ns of timing precision. The insertion loss of these GPIOs is really negligible (~4 to ~8 ns). Of these 16 GPIOs, we dedicate 8 bits for the Process ID (PID) Bus. The Kernel places the PID of any process running on the PID bus, allowing a real-time detailed trace of the running system. The analog DACs can be hooked on any signal path node to observe the signal before and after a FIR filter, in real-time, to perform a unit test of the filter function, for example.
These GPIO lines are part of the final system and are used to verify the system on real control tasks.
Although our Kernel class is really minimal (the task switch takes 13 instructions), the Kernel captures thread telemetry and can show in real-time the process times of all running threads.
Only after the subsystem passes the Unit Test cases, running on real hardware, is it merged on the mainstream git branch.
This approach is extremely effective, and we have used it to write and test everything from hard real-time ADC signal paths to complex networking code, in addition to low-level Wireshark monitoring. The pinpointing of interface errors and debug logs, heavy system loads, and design defect discovery is facilitated by the unit test command tools.
This is in stark contrast to commercial unit test tools, which usually implement a layer of instrumentation on the interfaces of the functions under test to capture, log, and inject parameter data flow through the running system. The problem with those tools is that usually they impose a processing load on each instrumented function interface, and that interferes with the normal processing time of the functions. In a hard real-time system, this processing time insertion loss can be relevant, and it changes the dynamic behavior of control loops, for example.
Another caveat of traditional unit testing code instrumentation is that the testing system behaves differently than the field system. Some very hard design defects can be timing-related, and when you instrument the system you “solve” the issue.
We are now implementing in-system ARM CoreSight support for on-chip circuitry to help catch errors and perform non-invasive measurement as part of the running system to allow unit testing and monitoring of code.
So, our approach to Unit Testing is to design the testing structures as part of the final system, in a way that the observation and measurement of the code units is a standard base function of the system.
Phew! I couldn’t have said it better myself. I would say that I was sorry I asked, except that I found Jonny’s explanation to be riveting.
Just reading the above has my poor old noggin churning with thoughts, the main thoughts being (a) I’m glad I’m not a software developer and (b) I’m glad I don’t have to implement the GridVortex unit test procedure in my own code. Having said this, if I were to have to trust my life to an embedded system, I would be happier if it were one that had been designed and implemented by Jonny’s team using the process described above. But, yet again, we digress…
Introducing MPLAB Code Coverage
Before we start, let’s remind ourselves that, if an embedded software developer uses code coverage at all, it’s quite possibly a tool that started life in the high-level application world — that is, software applications designed to run on personal computers, workstations, and servers — and that was subsequently “evolved” (shoehorned) to serve the embedded world.
If you’re not careful, ensuring high test coverage of embedded software using traditional code coverage tools often requires some amount of hardware modification, expensive software, and significant effort searching large data files for pertinent information. Even worse, measuring code coverage in an embedded system oftentimes requires the use of a test system that is substantially different to the original design.
These problems are only exacerbated by the fact that code coverage often occurs late in the development process, by which time both the hardware and software have been optimized for cost and the system closely meets the specified requirements. Starting code coverage analysis at this stage often requires adding “printf” statements or some type of serial transmission code into every function so the microcontroller can say “Program Counter = X.” Once these code segments are added throughout the project, code resource requirements often exceed the limits of the cost-optimized controller. One alternative is to replace the microcontroller with a larger memory variant (hopefully one is available in the same package).
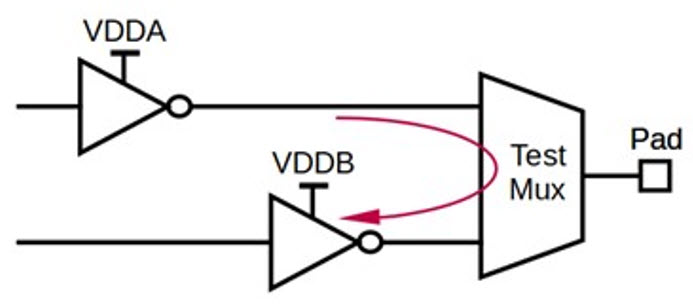
The device also needs a communication channel to output information, such as a UART. It’s unfortunate if all available channels are already being used by the application, because this will require some nifty footwork. Furthermore, since execution speed has likely been bogged down with the extra code, especially in the case of a real-time application, it may be necessary to increase the MCU’s clock speed to boost system performance.
What I’m going to say next almost seems like an anticlimax, but I’m going to say it anyway. No tool knows your code better than your compiler. If you have MPLAB Code Coverage, all you have to do is activate the “Code Coverage” feature in the MPLAB Compiler before you compile your code. Microchip’s compilers can determine the optimum number of instrumentation points needed and where to place them to minimize impact to code size and performance (analysis shows that the MPLAB Code Coverage tool uses only one half to one third the instrumentation points of competitive offerings).
But it gets even better, because the impact of MPLAB Code Coverage is typically less than 1% of program memory, which means you can perform your code coverage analysis using the same hardware as the real-world system (if your application is already using 99% of the available program space, then you have other problems, including the fact that someone is about to stick their head around the door saying, “We need to add one more feature — don’t worry, it’s only a little one, but I promised the boss you’d have it working by tomorrow).”
Can things get better? Why, yes they can, because all of the code coverage data is stored on-chip using a miniscule amount of data memory, which means (a) you don’t have to tie up any of your communications channels while testing and (b) there’s minimal impact on the application performance.
Once the application test run has been performed, you can retrieve the code coverage data from the chip and display it in the MPLAB X IDE, which is tightly integrated with the MPLAB Code Coverage tool. Every line of source code and every assembly instruction is marked as either fully or partially executed or not executed at all. Furthermore, you can easily switch between views to see code coverage at the assembly instruction level, the source line level, the function level, the file level, and the project level.
Yes, of course you can generate custom reports in both HTML and CSV formats with selectable content to meet your specific quality certification needs (I thought that would go without saying, but then I decided to say it anyway).
As David noted in his Measuring Code Coverage in an Embedded System blog: “MPLAB Code Coverage is the simplest code coverage tool on the market, just enable it in MPLAB X IDE, then build, program, exercise and read your device.” One thing David neglected to mention is that MPLAB Code Coverage works with all of Microchip’s MCUs, including the 8-bit versions.
And so we come to the “nitty-gritty” in the form of pricing, which can be summarized as follows: MPLAB X IDE is always free; MPLAB XC compilers have pro and free versions; and MPLAB Code Coverage — which comes as a workstation license for $799 with no maintenance fees — works with both the free and pro versions of the MPLAB XC compilers.
Remembering that I create most of my hobby projects using processors that can be programmed using the Arduino IDE — including Arduinos (of course), Teensy devices from PJRC.com, and the awesome ShieldBuddy from HITEX.com (see also Everybody Needs a ShieldBuddy) — I’m delighted to report that David just informed me of a nice MPLAB X IDE feature of which I was previously unaware, which is that it can import Arduino projects, which means MPLAB Code Coverage can be used with them, too.
At the end of the day, I’m left pondering one vital question: “Is there any chance we could persuade Microchip to create an equivalent Arduino IDE Code Coverage tool?” Perhaps something that could be downloaded for free with limited capabilities such that it could report coverage only at the function and source line levels. All I can say is that, if such a frabjous day should ever come to pass, I know a lot of people who would be dancing in the streets, and your humble narrator would be found at the head of the parade.