If you’re a visual learner like myself, then you know maps, charts and info graphics can really help bring data and information to life. Maps can make a point resonate with readers and this collection aims to do just that.
Hopefully some of these maps will surprise you and you’ll learn something new. A few are important to know, some interpret and display data in a beautiful or creative way, and a few may even make you chuckle or shake your head.
via A Sheep No More
January 10, 2014
One thought on “40 maps that will help you make sense of the world”
Leave a Reply
You must be logged in to post a comment.
featured blogs
Apr 25, 2024
Structures in Allegro X layout editors let you create reusable building blocks for your PCBs, saving you time and ensuring consistency. What are Structures? Structures are pre-defined groups of design objects, such as vias, connecting lines (clines), and shapes. You can combi...
Apr 25, 2024
See how the UCIe protocol creates multi-die chips by connecting chiplets from different vendors and nodes, and learn about the role of IP and specifications.The post Want to Mix and Match Dies in a Single Package? UCIe Can Get You There appeared first on Chip Design....
Apr 18, 2024
Are you ready for a revolution in robotic technology (as opposed to a robotic revolution, of course)?...
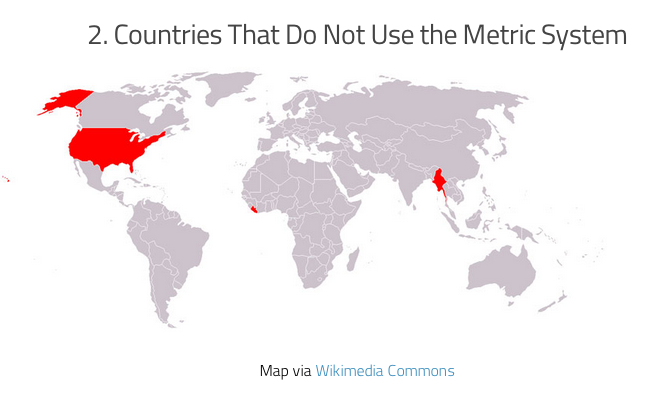
See…? People all over the world don’t use the metric system.
Clearly we’ve made the right choice.