


There are many difficult-to-answer questions. For example: At what point does ‘a few’ become ‘several’ When does ‘soon’ become ‘never’? How long will this take? (How long have you got?) When will it be done? (Define ‘done’?) Is it backward compatible? (With what, exactly?) How many devices around the world are running code no one fully understands? How many engineers are currently Googling the same error message? Why are the French [your query goes here]? And the list goes on…
One question I’m often asked—and one I often ask myself—is, “How many people are currently involved in developing embedded systems?” Counting engineers is a slippery problem (especially mechanical engineers, because they are often dripping in oil). I’d hazard a guess that there are probably between 2 and 4 million embedded professionals globally (depending on how we define ‘embedded’ and ‘professionals’), including both hardware designers and software/firmware developers.
Furthermore, remember that the ‘hardware’ bucket includes PCB designers, FPGA engineers, ASIC designers, analog engineers, RF engineers, power engineers, and so on. This means that at the industry (macro) level, embedded software engineers likely outnumber hardware engineers by a ratio of perhaps 2:1. However, at the product-team (micro) level, particularly once hardware has stabilized, it’s not uncommon to see software outnumber hardware by 5:1 or more. This reflects the fact that hardware is largely front-loaded while software grows over time (product features keep expanding, and maintenance and updates persist long after hardware freezes).
I know I’ve used a lot of weaselly words here, but that makes it harder to argue I’m wrong, and we should always remember the old saying, “Eagles may soar, but weasels rarely get sucked into jet engines” (and it’s hard to argue with logic like that).
Now I have another question for you. How many embedded system development teams around the world are using the tools from Percepio? The answer to this one is easy: “Not as many as there should be!” Percepio is a relatively small player in the embedded tooling space, but among the engineers who use its tools, the enthusiasm borders on evangelical. For example, when I have questions about embedded software, my “go-to” source is Jacob Beningo, founder and chief executive of the Beningo Embedded Group. Suffice it to say that Jacob is constantly singing the praises of Percepio’s tools, and that’s more than good enough for me.
The reason for my waffling here (yes, of course, there’s a reason) is that I was just chatting with Johan Kraft, who is the CTO at Percepio. The purpose of our conversation was for Johan to bring me up to speed on their recently announced Percepio Detect offering. Before we go there, however, it might be a good idea for us to remind ourselves of their existing tools, Percepio Tracealyzer and Percepio Devalert.
Percepio’s first product, Tracealyzer, is best thought of as a high-resolution MRI scanner for RTOS-based systems. It doesn’t just tell you that something went wrong; it shows you what happened, when it happened, who did it, and who they were waiting for at the time.
Tracealyzer supports a wide range of RTOSes, including FreeRTOS, Zephyr, and VxWorks, and provides deep visibility into threads, interrupts, synchronization primitives, queues, mutexes, and multi-core scheduling. Instead of squinting at printf outputs squirting out over a UART (at several milliseconds per line), Tracealyzer logs events in microseconds by copying them into RAM buffers. The overhead is minimal; the insight is maximal.
Traditional trace tools tend to show you a flat list of events, which can be really useful (especially if you already know what you’re looking for). By comparison (and in addition), Tracealyzer also offers a more “top-down” approach. It can generate higher-level visual abstractions—CPU load charts, dependency graphs, communication flow diagrams—so you can see anomalies long before you know what they are.
If Tracealyzer is your lab instrument, DevAlert is your early-warning system for deployed products. In many embedded systems, the most interesting bugs don’t show up on a weekday afternoon in your lab. Instead, they show up at 2:17 a.m. on a Saturday morning at a customer’s site, on a firmware revision you thought was “stable,” under real-world conditions that no one thought to simulate (and that’s the good news).
DevAlert enables runtime monitoring in deployed systems and allows selected diagnostics—traces, logs, crash information—to be captured and reported when specific events occur. Instead of waiting for a customer to say, “It froze,” you can instrument your firmware so that when something anomalous happens, the device leaves behind a breadcrumb trail. In short, Tracealyzer helps you understand what’s happening, while DevAlert helps you know that something has happened.
While Tracealyzer focuses on deep interactive debugging in the lab, and DevAlert extends visibility into deployed systems, Percepio Detect addresses a slightly different—and increasingly important—problem: continuous observability across an entire development team.
Detect is not simply “another trace tool.” Rather, it’s a systematic framework for automatically monitoring RTOS-based systems during testing (especially in continuous integration environments) and capturing focused diagnostic snapshots when something anomalous occurs. Instead of recording everything all the time, Detect watches for specific conditions—faults, timing violations, unusual CPU load patterns, stalled threads, watchdog resets, or user-defined triggers—and then preserves just enough context to explain what happened.
In other words, Tracealyzer helps you investigate problems you’ve noticed. Detect helps you notice problems you might otherwise miss.
As Johan put it during our conversation: “Tracealyzer is more like an old-school tape recorder. You press ‘Record,’ you record for a while, you press ‘Stop,’ and then you look at what happened. By comparison, Detect automatically provides small snapshots of particular events.”
That distinction is profound. Tracealyzer captures what you decide to record, while Detect captures what you didn’t even know you needed to look at. Detect is designed for continuous integration environments and team-wide observability. It runs as a Docker-packaged client-server solution with a shared dashboard and database, so multiple engineers across multiple devices can see the same anomalies.
Most of the time, Detect watches quietly. Data sits in RAM and is overwritten. And CPU overhead is typically around 1%. But when something crosses a threshold—a hard fault, a watchdog reset, a CPU load spike, a task that stops running, a deadline violation—Detect captures a focused snapshot (RTOS trace context, core dump, stack trace, custom metrics, user-defined alerts).
Instead of streaming gigabytes of telemetry to someone else’s cloud, Detect is designed to run in your own infrastructure. All data stays yours, which is an increasingly important consideration in a world of data sovereignty and regulatory constraints. This is less about logging everything and more about capturing the right few hundred bytes at exactly the right moment.
As an aside, one of the many things I didn’t expect to hear myself say when I woke up this morning is, “Dining philosophers strike again!” But here we are. The Dining Philosophers Problem is the canonical example of a concurrency nightmare. In a crunchy nutshell, the idea is that several philosophers sit around a table. Each philosopher has a plate of food in front of him (or her). Sometimes the philosophers want to think, other times they want to eat. There is a fork between each pair of adjacent plates. Each philosopher requires two forks to eat. If they pick the forks up in the wrong order, deadlock ensues, and some of them starve.
If you learn anything from this column, let it be that you don’t want to get on the wrong side of a hungry philosopher armed with a sharp fork (tell all your friends—they’ll thank you later).
Johan showed me an example of this running. In this demo, Tracealyzer visualizes a Zephyr-based RTOS implementation of the dining philosophers problem in action. The screenshot Johan shared below shows three synchronized views: (a) Trace view (left): A time-aligned event stream, (b) Communication flow view (center): Threads as rectangles, mutexes as hexagons, dependencies mapped visually, and (c) History view (right): Detailed chronological event listings.
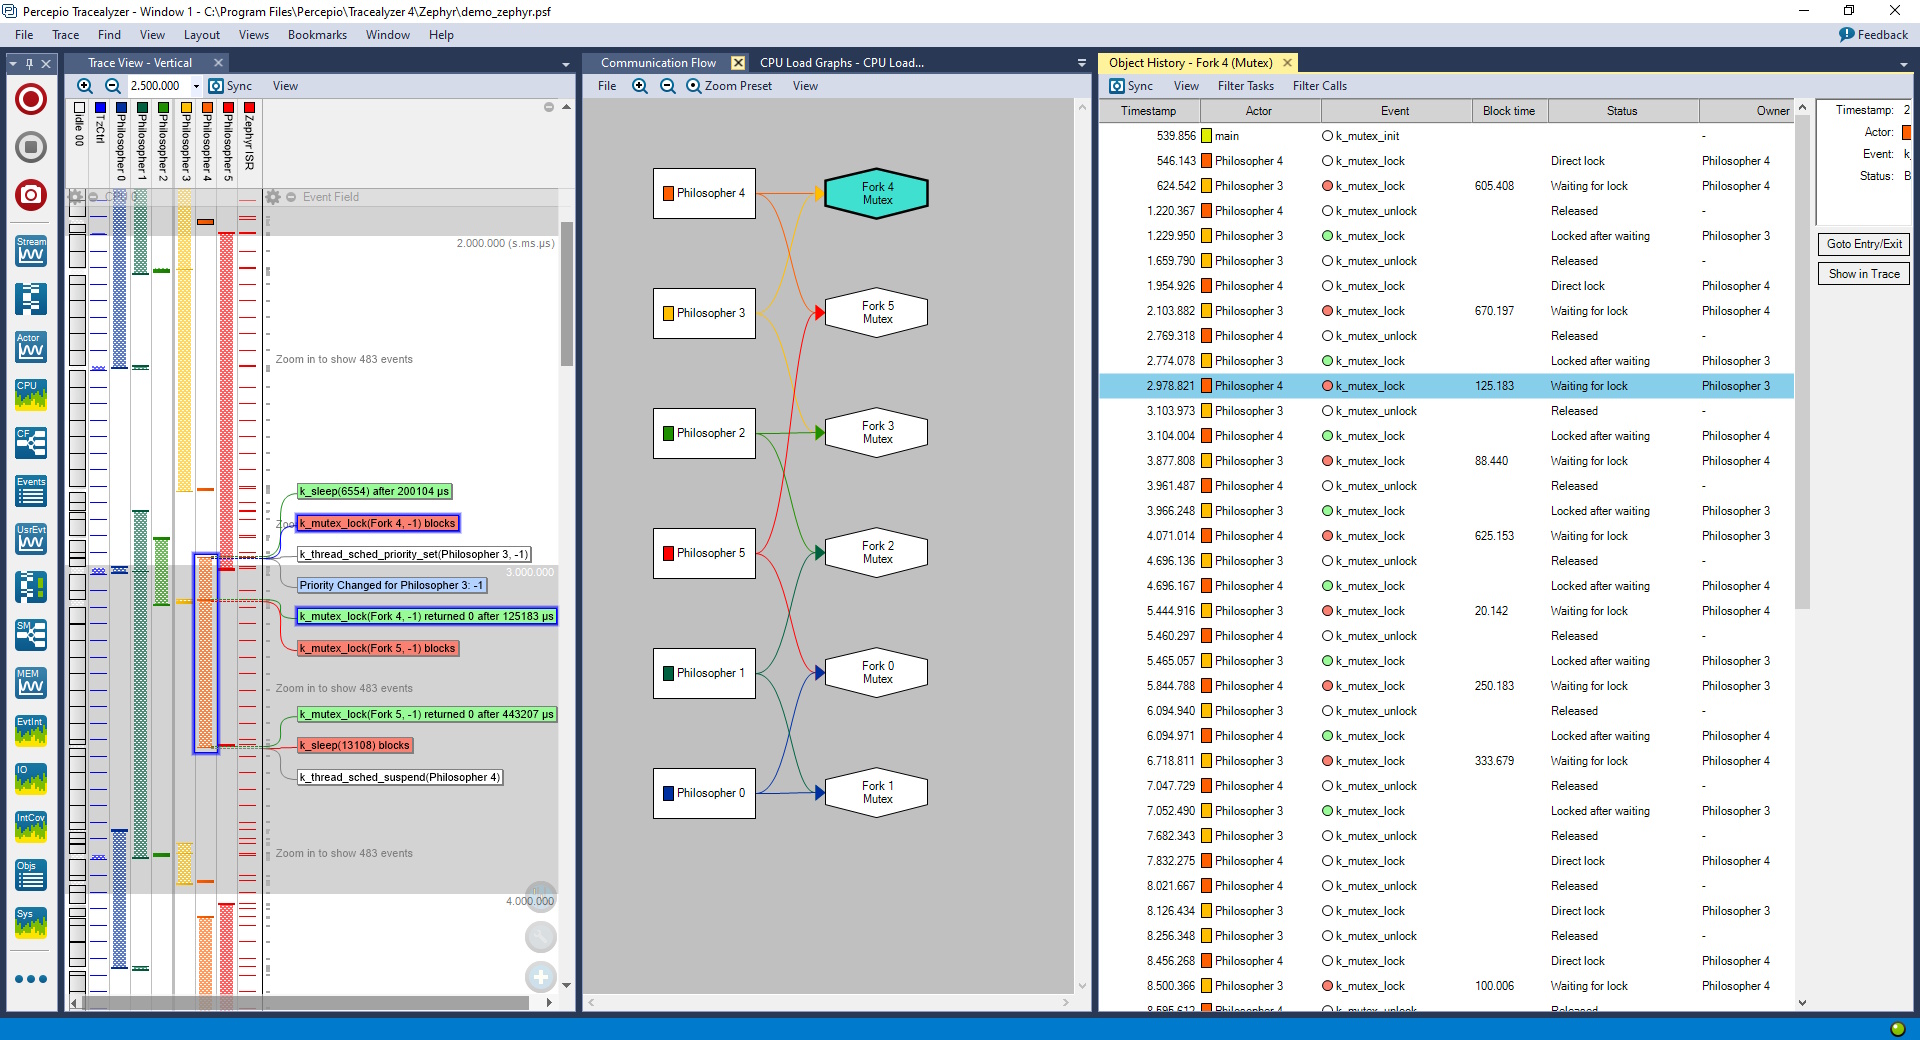
Tracealyzer visualization of a Zephyr RTOS-based implementation of the Dining Philosophers Problem (Source: Percepio)
At a glance, you can see which philosopher (thread) is waiting on which fork (mutex). You can see priority changes, lock contention, and blocking times. And you can double-click on the abstracted graph and drill directly into the precise RTOS calls that led to a stall.
In a real production system, the diagram won’t be this tidy. It will be a lot messier. More threads. More queues. More dependencies. But that’s precisely where Tracealyzer shines. It gives you a top-down map before you descend into event-level detail.
And here’s the important bit: Detect can be configured to automatically capture this kind of context when something anomalous occurs. If one philosopher stops eating forever, or if the CPU load for a task spikes from 10% to 99%, Detect can trigger a snapshot without anyone pressing “record.” In other words, even if the philosophers misbehave at 3 a.m. while you’re tucked up in bed snoozing furiously, you’ll still be able to find out who grabbed which fork when.
The really cool thing is that Tracealyzer, Detect, and DevAlert can be used together. The folks at Percepio refer to the combined use of these tools as Continuous Embedded Software Observability. This is a three-layer model:
- Tracealyzer: Deep interactive lab debugging.
- Detect: Automated, team-wide, anomaly-triggered observability in CI and
beyond. - DevAlert: Runtime alerts in deployed systems.
This means that, instead of regarding debugging as a post-mortem activity, observability can be treated as a permanent design feature. This is especially important in modern embedded systems that feature preemptive, priority-based multi-threading, multi-core MCUs, complex middleware stacks, security-sensitive deployments, over-the-air (OTA) updates, and continuous integration pipelines.
In these environments, rare timing bugs, race conditions, and resource edge cases multiply. Detect acts as a safety net, catching firmware freezes, partial stalls, unexpected execution paths, and subtle overload conditions before they become customer-visible failures.
As another aside, if you are planning to attend the Embedded World Conference and Exhibition, 10-12 March 2026, in Nuremberg, Germany, then you can see all of this in action. The guys and gals from Percepio will be showcasing their Continuous Observability solutions at the Logic Technology stand (Hall 4 / Booth 4-238) and the Zephyr Project stand (Hall 4 / Booth 4-170). Feel free to tell them, “Max says Hi!”
There are many hard-to-answer questions in embedded systems space (where no one can hear you scream). How many engineers are working on embedded systems? How many devices are running code no one fully understands? And perhaps most importantly: how do we really know what our firmware is doing when no one is looking?
Percepio’s tools don’t eliminate bugs. Nothing does. But they dramatically reduce the time between “Something feels wrong” and “Ah ha, there it is!” Percepio Tracealyzer lets you explore. Percepio DevAlert lets you listen. And Percepio Detect lets your system speak up when something isn’t quite right.
And if this helps you avoid being metaphorically forked by an allegorically dining philosopher at the worst possible moment (there’s never a good one), then I’d call that a rather tasty outcome indeed.

