It sounds like old times, something that’s been done before.
You take a bit of extra logic, tap into your JTAG infrastructure (pun intended), add some IP, and look into what’s happening with your FPGA. And you’d say, “Oh, that sounds like Altera’s SignalTap or Xilinx’s ChipScope.”
OK, so then say you add some logic to your ASIC, capture and compress a bunch of data, and decompress it on the way out. And you’d say, hey, that sounds sort of like DFT (Design for Test) technology. Sort of. Maybe. (With DFT, usually the stimulus, not the result, comes in compressed and is decompressed on-chip, but it has a similar feel.) Or you say, hey, that sounds like the debug infrastructure that ARM and MIPS provide.
OK, so say you can do both of those things across multiple FPGAs or ASICs. And you do it at the RTL level, pre-synthesis. And, unlike DFT, you can capture not just a single-cycle pass/fail result, but also a history for backtracking how a particular state was reached. And, unlike with the ARM and MIPS debug stuff, you’re debugging not just software, but hardware at any level.
And now it doesn’t quite sound like something that’s been done before.
So let’s start over again.
Let’s assume the test problem has been solved; we’re not going to talk about test or DFT. Debug is another matter. In fact, as I found when looking deeper into SoC debug last year, most tool vendors don’t even think about hardware debug. They’re interested in having you spend big bucks on pre-hardware verification and debug so that you never have to get to the point of doing hardware debug due to a failed chip.
So leave it to Brad Quinton, CTO of Veridae, to crash that party with what he sees as a sobering truth: “Very few chips actually get to first silicon success.” And after all those tools and all that verification time. To quote Malibu’s Most Wanted, “All that buffness for nothin!”*
So here we are, then, with FPGAs or silicon that ain’t what they’re supposed to be. It’s not like debug is completely impossible. As we’ve seen, there are ways of doing an FPGA laparoscopy one-at-a-time, and you can do low-level hardware-assisted software debug. But what about detailed hardware debug on an SoC? Or on the group of multiple FPGAs that are being used to prototype the SoC? According to Veridae (based on ITRS numbers), by 2014, your SoC will have less than 50 pins per million gates. That makes it very difficult to look inside and peer around in any meaningful way if something goes wrong.
This is the problem that they’re trying to solve with their Clarus product. You could sort of say that it’s like a traditional FPGA debug system on steroids. It’s deployed across multiple chips on something of a network, with hardware IP and a set of software tools that manage the data and coordinate it into integrated views into the combination of chips as a whole.
The way this works is by instantiating a number of what they call “capture stations.” A capture station will be assigned to a particular portion of logic – it might be a chip or a clock domain within a chip. And, in fact, when you have multiple clock domains, the typical setup is to have a capture station per domain (although you can combine clock domains within a station using FIFOs).
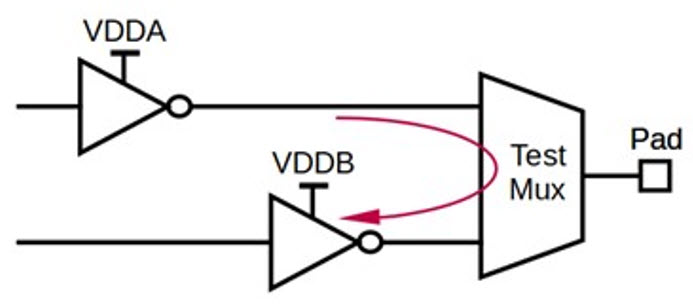
Signals get to and from the capture stations via a router (often one FPGA in a cluster is given supervisory status); 10 pins are used as dedicated I/O for this. In between the router and the JTAG TAP controller is an access control block, which not only provides optional security, but also allows a host CPU to access the setup.
The latter actually means that you can memory-map the debug circuit to the processor, have the debugger alert the CPU if something is amiss, and then the CPU can potentially work around the problem.
Of course, the other issue with debuggers is figuring out how to get access to thousands of signals through a few pins. No, wait, that sounds dated. How to get access to tens or hundreds of thousands of signals through a few pins. You only get so many chances to grab signals – and if you don’t know in advance what bug you’ll be looking for, how do you know how to instrument the system for viewing what’s going on?
You handle this through three choices. First, the Implementor tool (more on it later) ranks signals for you to help you decide where to put access. Next you select how many signals you want to be able to see, period. Then you select how many you can see at the same time. The latter can be any combination of the former. That means that, if you have 1000 signals visible, 30 at a time, then in a single capture you can see any combination whatsoever of 30 signals out of 1000. Don’t make me do the math on how many combinations that is. Please. I can’t fit that big a Pascal’s triangle on one piece of paper. It’s a lot.
Now if you actually want to see more than 30 signals (in this example), you can actually do more than one capture, each one having a different combination of signals visible. Under the assumption that you’re exactly re-creating the test case for each capture, you can then combine the captures into a single view.
The tools overlaying this also appear to be aimed at reducing some of the error-prone drudgery of dealing with debug. The Implementor tool helps with setup, ranking nodes, automatically discovering clocks, and generating test benches and formal scripts.
When it’s all in place and you’re in the act of debugging, the Analyzer tool lets you set up the captures, and then the Investigator tool takes the captured data and tries to do more intelligent stuff with it – mapping it to RTL, using known conditions like register settings, extrapolating indirect data, and tracing data backwards and forwards through the RTL.
So what does all of this get you?
Their claim through all of this is that, on a modern chip, by adding 1% more area to support the debug, the observability of the resulting chip (expressed as observation points per million gates) will be better than that of an old Intel 486. By adding 3%, it will be better than a 286.
Just like old times.
*Oh come on, admit it, you know you laughed during that movie. Even if only once.
More info: Veridae Clarus