
Cadence is proposing a new way to approach debug. It’s almost an obvious way, except that this isn’t how most debug has traditionally been done. The real reason this hasn’t been done before is simple: data. We’ll come back to that in a sec.
Their point is that, for most debug today, you have to anticipate where problems are likely to crop up and then manually instrument your code with “printf” statements (or the equivalent) so that you get some visibility into what’s going on with your program.
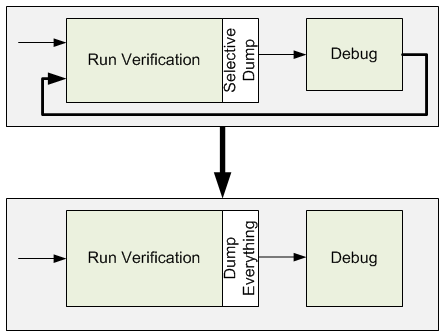
That works OK for your first simulation run – up to the point when something goes wrong without an accompanying printf to provide clues. So you go back and add more printfs and – and this is the key – you resimulate.
By Cadence’s estimation, 50% of verification effort is debugging, and 25% is running tests. Together, they’re ¾ of the pie. Each resimulation is more test time, and because the debug effort resembles successive approximation as you try to zero in on the cause, it’s less efficient. Their big idea is to make debug more directed and – this is the big part – make it 100% doable after only one verification run.
The result is Indago (no, it doesn’t sound like “indigo”; it’s “in-DAH-go,” apparently Latin for hunting or tracking). There are a few key pieces to this approach.
The main one is the fact that all artifacts – data, logs, code execution, etc. – are captured. In other words, instead of having to decide ahead which data to expose via printf, you simply get everything. That means that debug efforts have all the data they need – no subsequent runs to capture new data are needed.
From there, they have what they call “root cause analysis” that helps point you in the direction of a bug. When a signal is identified by the testbench as being incorrect, the tool can identify a short list of possible causes, and you can drill in from there (even crossing into third-party IP as long as it’s not encrypted).
Finally, they have three apps that they layer above this fundamental technology. One is their Debug Analyzer, which allows multi-language (SystemVerilog, e, and SystemC) code debug. The second is Embedded Software Debug, which helps debug co-verified software and hardware (and optimized for their Palladium emulator and Incisive simulator). Finally, Protocol Debug provides abstraction when debugging protocols so that you can observe what’s happening at a higher level.
These three apps can be run together at the same time. To some extent, they provide alternative views of the same information, and they stay synchronized. You can move back and forth between them, say, highlighting something in one and then viewing in another.
Indago isn’t tied to Cadence’s verification tools; it can also be used with other engines mixed and matched from different EDA providers.
Finally, a quick word on a buzzphrase that featured prominently in the announcement: Big Data. When you hear that, you might think Hadoop or Lambda Architecture or datamarts or NoSQL searches or any number of mysterious acronyms and algorithms and incantations. Anything up to the point of Deep Learning, which is yet another buzzphrase.
I tried to drill in to see what “Big Data” meant in this context. And, in fact, it’s mostly none of that prior stuff. It’s “big data” in the most general sense, the highest-level big-data concept. And that is, “Grab everything you can, up to and including your mother-in-law, and stash it away cuz you might need it someday.” Indago embraces that aspect – it’s key to eliminating subsequent verification iterations while debugging.
To my earlier point, it’s only in modern times that memory is cheap and big enough (and we can dump data to it fast enough) to where we can afford to be this “wasteful” – after all, an enormous percentage of that stored data will never, ever be used. Unlike in the past, that’s no longer an unacceptable cost. Accelerating debug is worth more than the extra storage.